Most of the nowadays cameras have possibility to show you a histogram and not a hole lot of people are using them because they don’t understand them. In fact, they are not that hard to read and can help you a lot to get a well exposed photo or in executing some of your creative ideas. So how do the histograms work?

It’s actually very simple. They represent a distribution of luminosity levels within you photo. Blacks are located on the far left of the histogram (value of true black color is 0), then come the shadows, midtones, highlights and then withes at the very right (true white has value 255). So, the more blacks and shadows your photo has, histogram will be moved more to the left. And yes, you guessed it, if your photo is primarily made of bright tones, histogram will be moved to the right. So far so good. But why do we need to know this and how can we use it to our advantage?
There are several reasons. First one is to make sure you get a correct exposure while shooting, without blowing out any highlights or shadows, also known as clipping. This means avoiding losing details due to over or under exposing your photo. How to do this with histogram? Just show a histogram on your camera screen (see your camera manual) and adjust exposure so that your histogram doesn’t touch left or right side of the graph.

Example of a properly exposed image with histogram going all the way from left to right, but not touching the edge.
Some scenes have very high dynamic range (difference between the brightest and the darkest tones in the frame), and it is almost impossible to capture everything with one exposition without clipping anything. In those cases, you will not be able to adjust exposure so that histogram doesn’t touch the edges of the graph. One solution to this problem is to use graduated filters if available and if applicable (for example for straight horizons in landscape photography), so that you darken the brightest parts and reduce dynamic range of the scene. Second solution that doesn’t require any additional gear is to bracket several shots (normal exposure, underexposed and overexposed shoots) and then merge them in post processing in Lightroom or Photoshop to get a well exposed photo with all the details preserved (will be covered in another tutorial).
Exposure with no clipping in the shadows
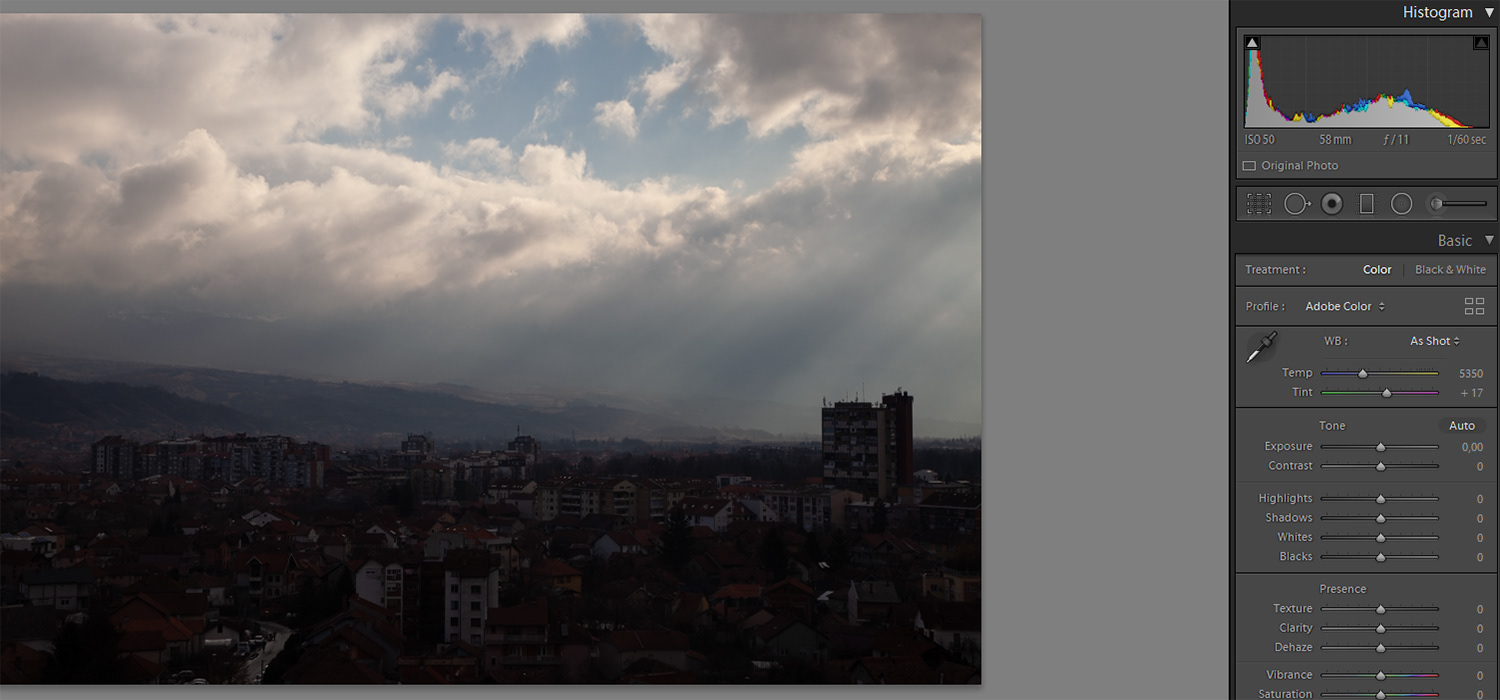
Exposure with no clipping in the highlights
You can find an edited version of this photo in my Cities and architecture gallery.
Second usage of a histogram comes in post processing, when you are trying to increase contrast of your photo. How to do this? Again, very simple. Contrast is difference in luminosity between dark and light parts of a photo, so to increase contrast, we need to increase that difference. We do that by moving the blacks all the way left (while watching the histogram to avoid clipping) and whites all the way right (while again watching the histogram, you already know why). This way we also cover the whole dynamic range that is available in our photo.
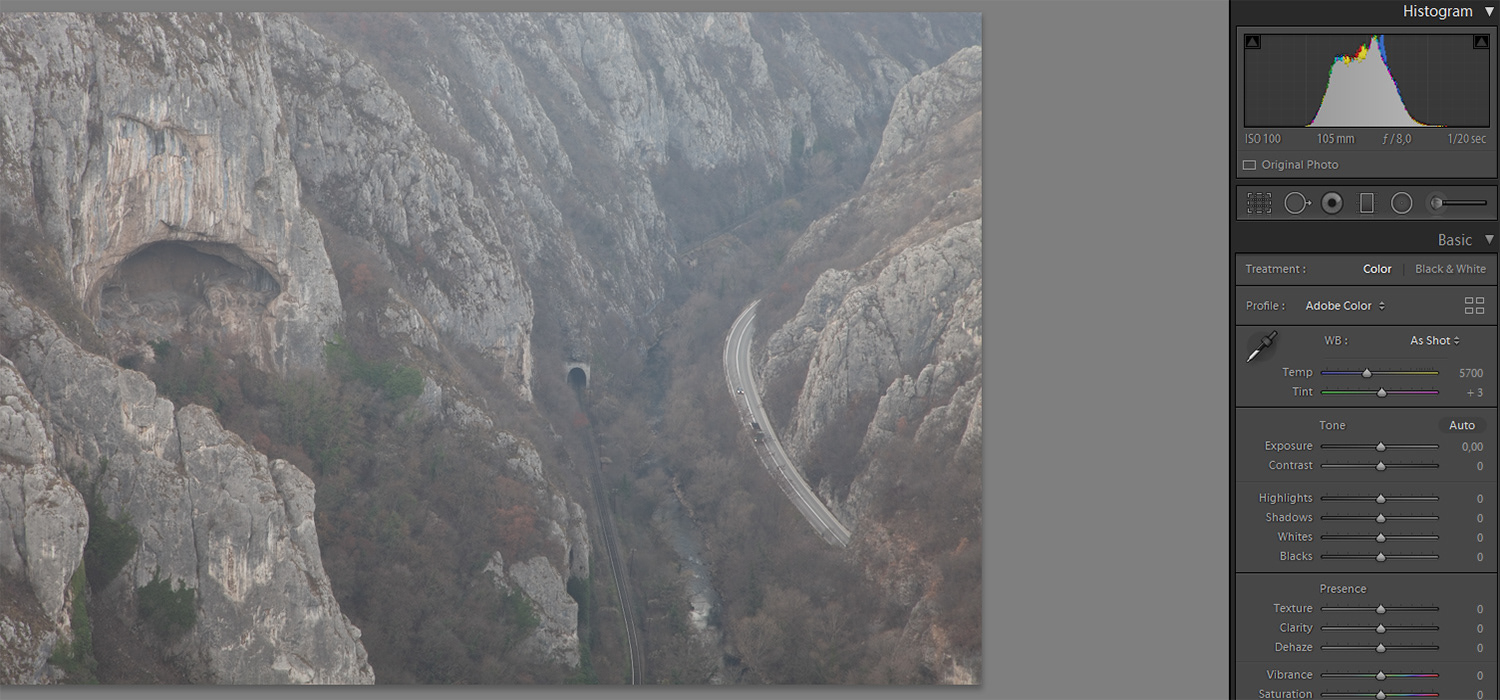
Unedited RAW file, histogram shows no real blacks or withes
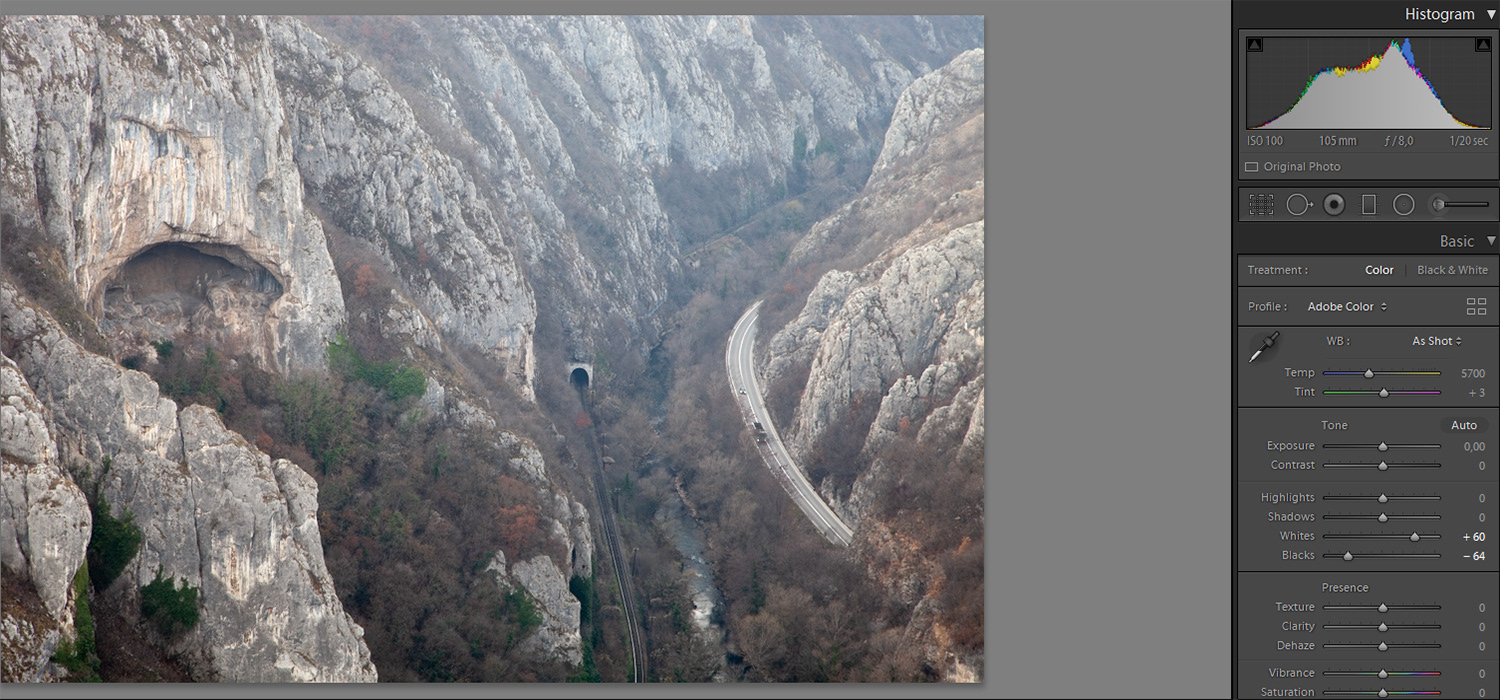
Streched histogram by decreasing blacks and increasing whites in Adobe Lightroom, one of the ways to add contrast
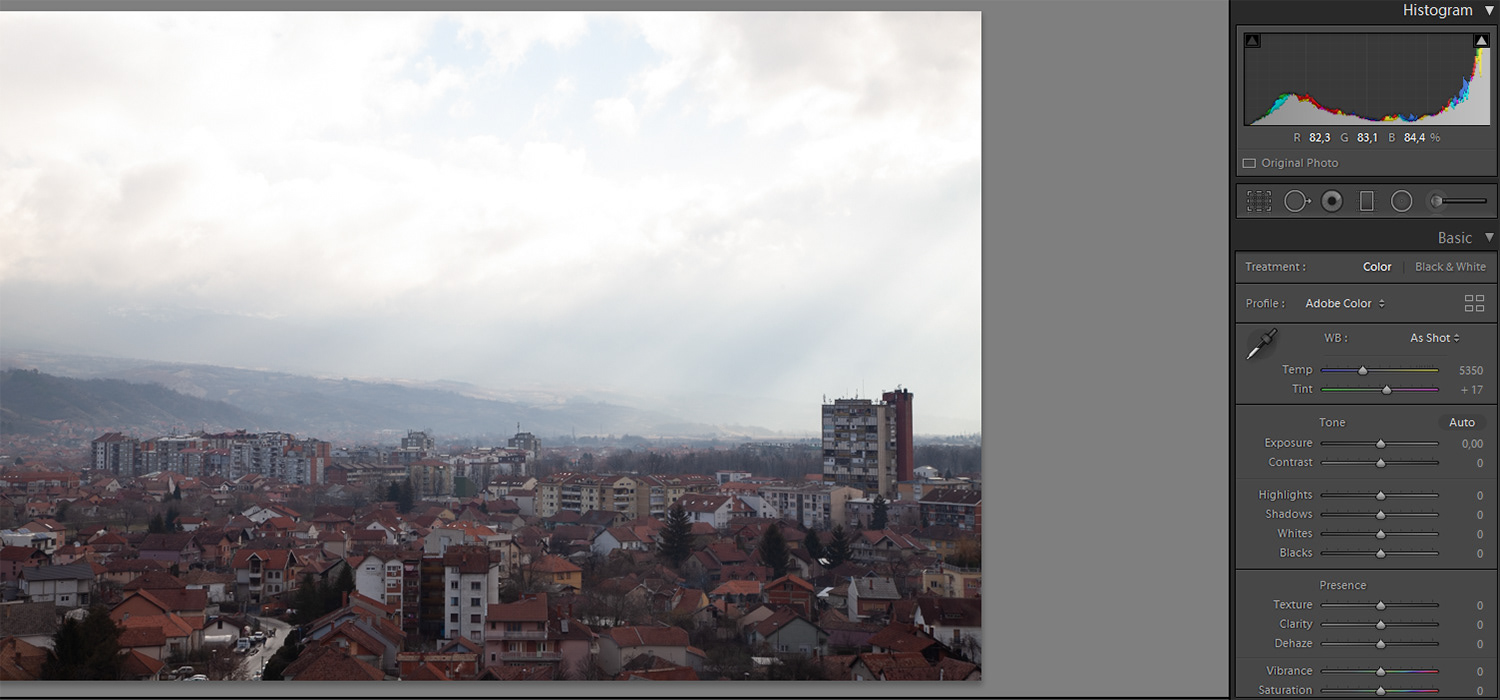
It is important to mention that not all the photos need to have a lot of contrast, or to cover the whole dynamic range. For example, a night photo doesn’t have to have the brightest whites, just like a photo taken on a snowy, misty, winter day doesn’t need to have the darkest darks. So even though this rule applies to majority of photos, there are exceptions like always. And it can also be a creative decision if you are going for that high key (photo with a lot of bright tones and very little or none midtones, shadows and blacks) or low key (the opposite) look. This can be achieved in post processing, but also on field, by adjusting exposure and placing the histogram where you want it to be.
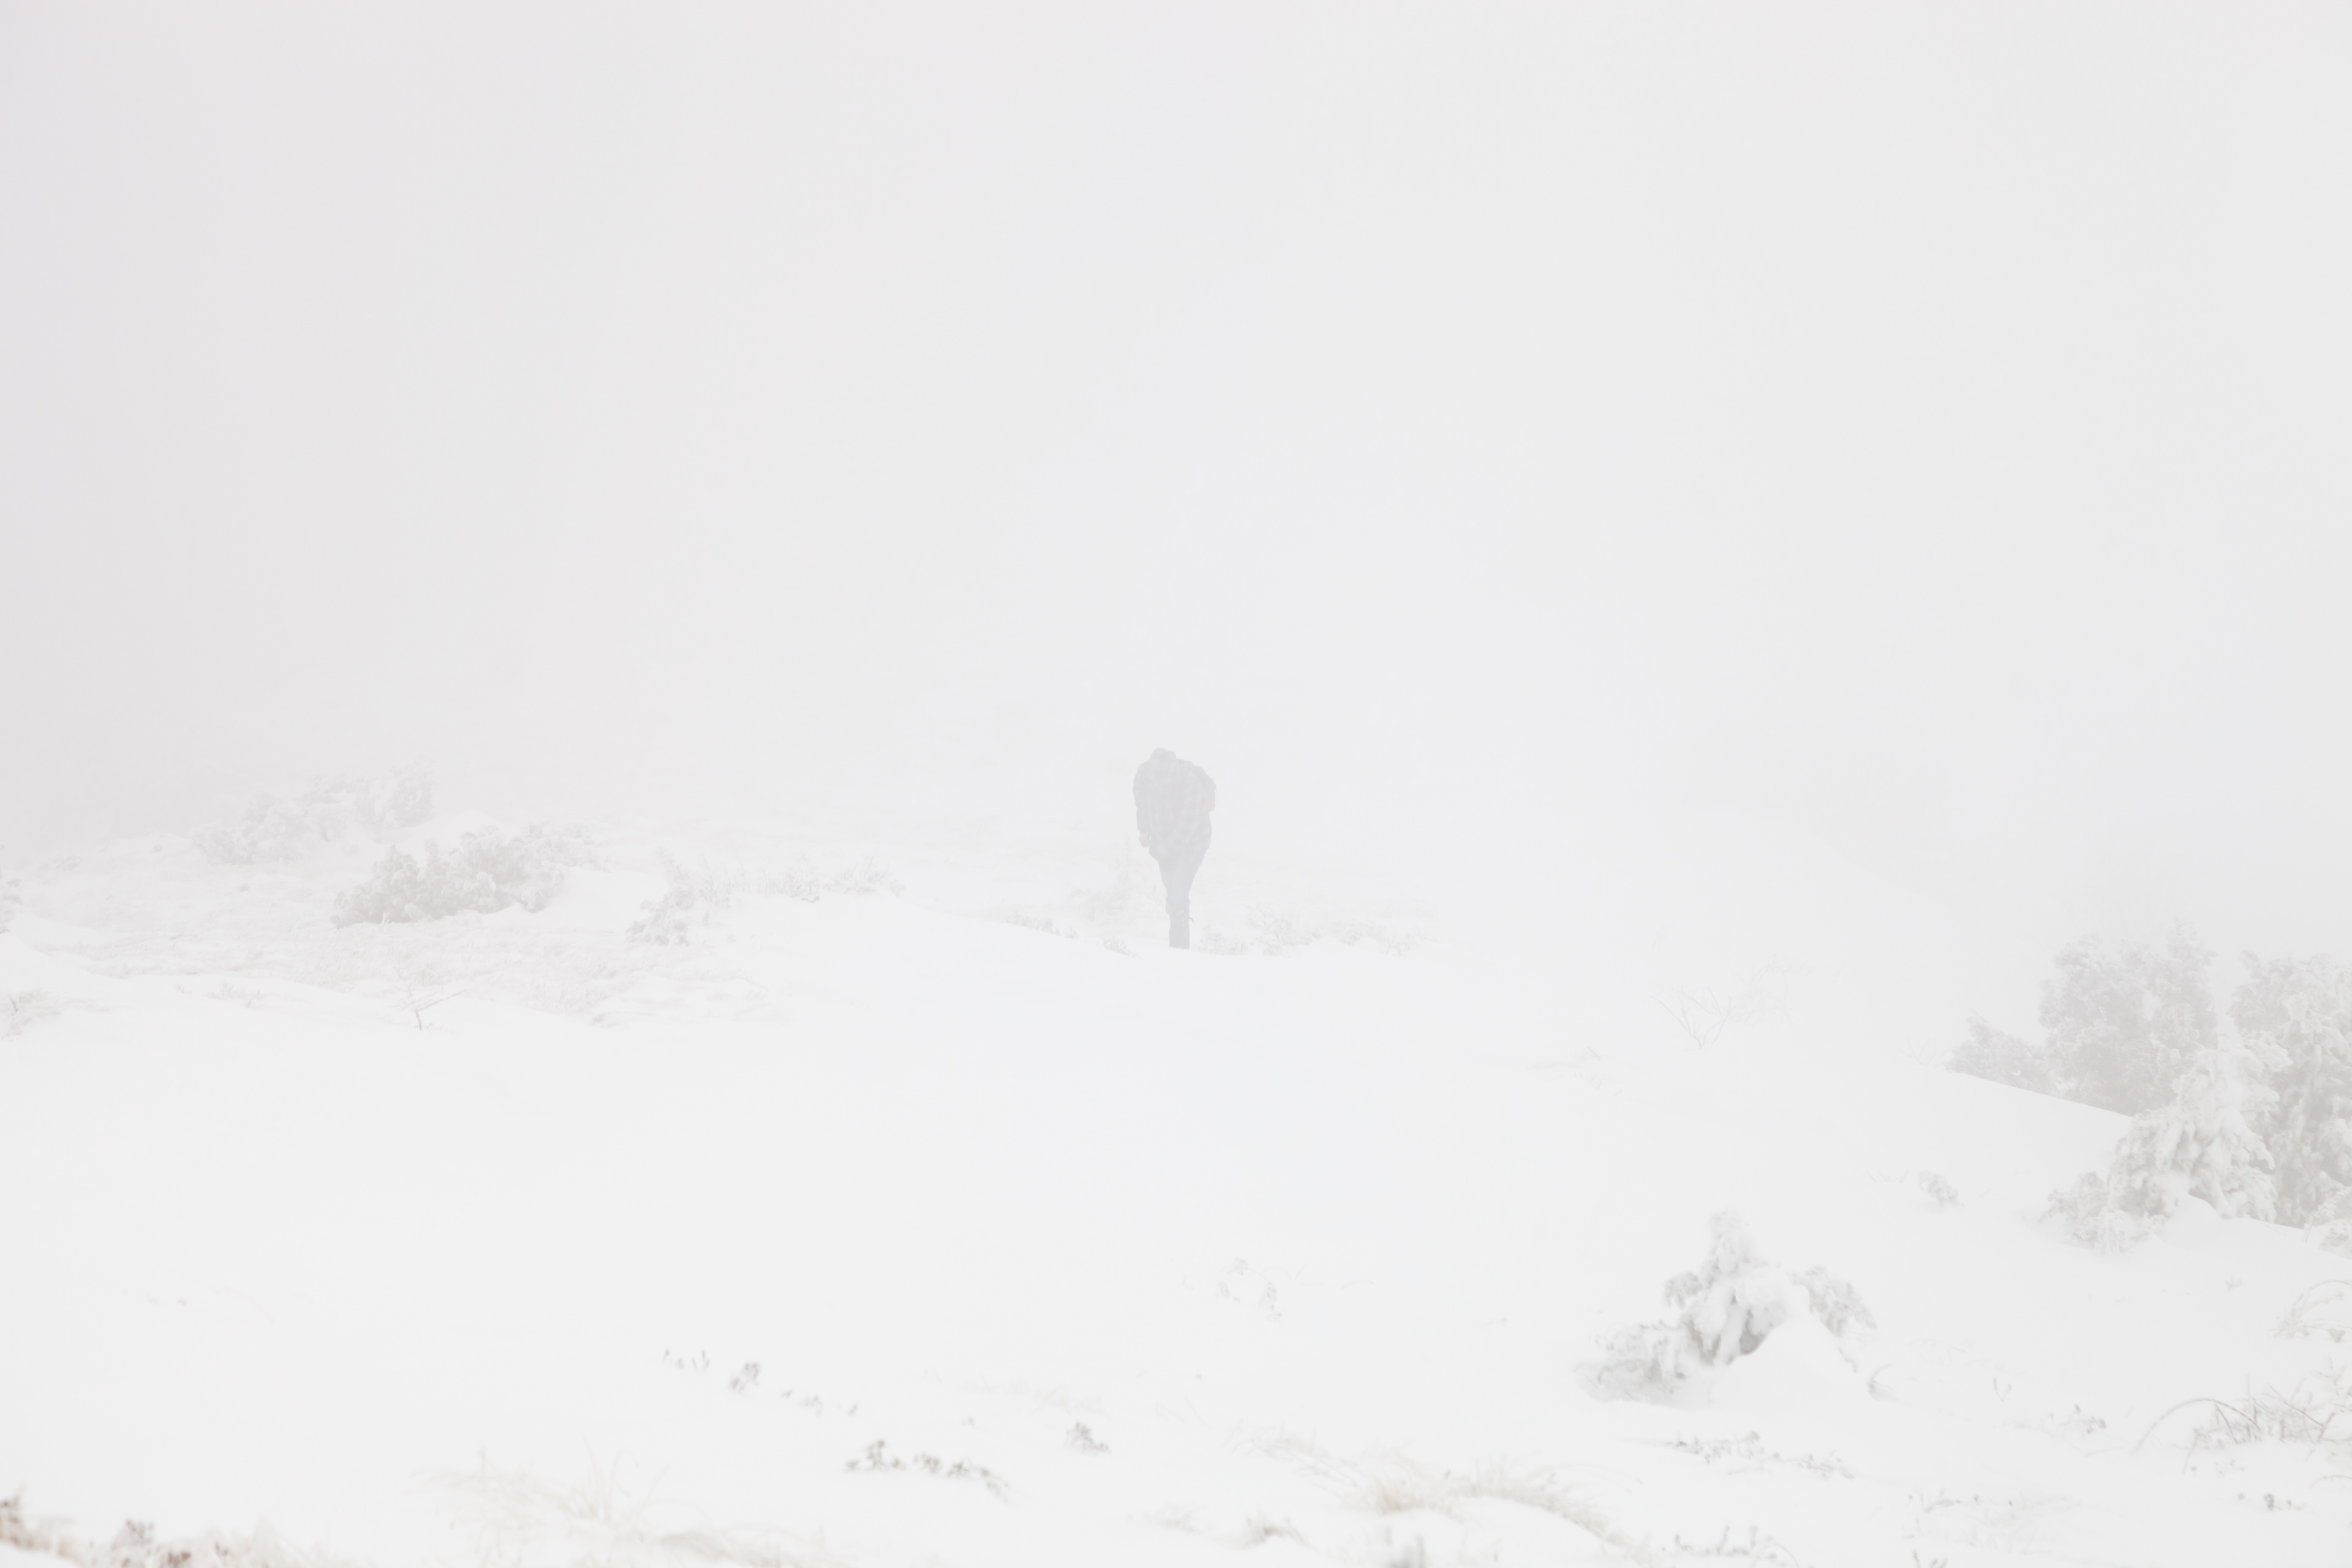
Example of high key image, no real blacks and very little shadows.
For the end, I will briefly explain one more technique used to get as clean file as possible as a final result. It’s called expose to the right (ETTR) and it means exactly that, expose so that your histogram is as far right as possible, but without clipping. Why would you like to do this? Answer is again very simple when you think about it. This way you get as much detail in the darker parts of your image, so you don’t need to increase exposure, open up the shadows or blacks in post processing as much as you would need if you didn’t ETTR. And this is important because doing this introduces noise and it degrades the quality of the photo, so when possible, we want to avoid it.
I hope this tutorial helped you understand how to read and use histogram on your camera and in your editing software and that next time you go out shooting or sit to edit your photos, you will pay attention to this extremely useful tool.
Happy shooting!